Webサイトをグラフで表示 - Websites as Graphs

http://www.aharef.info/static/htmlgraph/
Webサイトを構成しているHTMLタグを階層グラフで表示してくれるサービス。
ただそれだけなのだけど、なんとなく綺麗なのでご紹介。
表示されるグラフには青とか赤のノードが存在してて、それぞれ以下のような意味合いです。

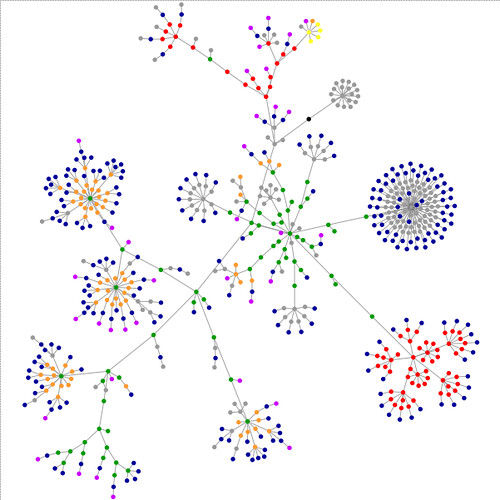
blue: for links (the A tag)
red: for tables (TABLE, TR and TD tags)
green: for the DIV tag
violet: for images (the IMG tag)
yellow: for forms (FORM, INPUT, TEXTAREA, SELECT and OPTION tags)
orange: for linebreaks and blockquotes (BR, P, and BLOCKQUOTE tags)
black: the HTML tag, the root node
gray: all other tags
試しにこのブログでグラフを作ってみました。
もうちょっと幾何学的というか規則的な感じだったらよかったけど、まあこれはこれで美かな。
Flickrで『websitesasgraphs』タグで検索すれば、他のサイトのグラフを見つける事ができます。
websitesasgraphs photos on Flickr | Flickr
自分以外のグラフの方が綺麗に見えるけど、『隣の庭は良く見える』ってことでしょうか。
